SLIDE 01
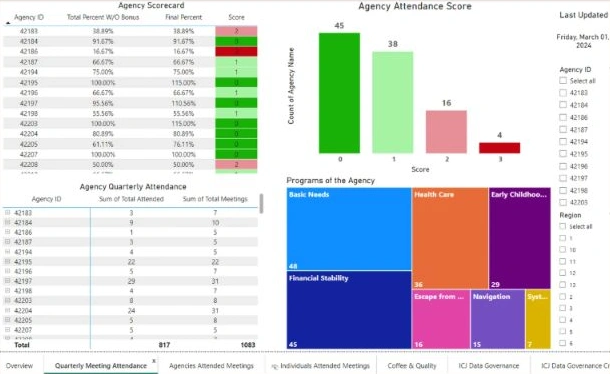
Quarterly attendance
PROJECT / Professional / Power BI
Power BI dashboards bringing together agency compliance, meeting attendance, regional engagement, and technical assistance webinar reporting.

01 / THE QUESTION
How can dashboard reporting support a grants and compliance analysis role?
02 / THE APPROACH
03 / KEY INSIGHTS
The report views separate agency-level compliance from individual participation and webinar questions, helping users examine each part of the reporting picture with relevant filters and comparisons.
04 / OUTCOME & IMPACT
Created a set of Power BI report views for reviewing agency compliance, attendance, engagement, and technical assistance activity.
THE PROJECT IN DETAIL
SLIDE 01
SLIDE 02
SLIDE 03

SLIDE 04

SLIDE 05

SLIDE 06

SLIDE 07
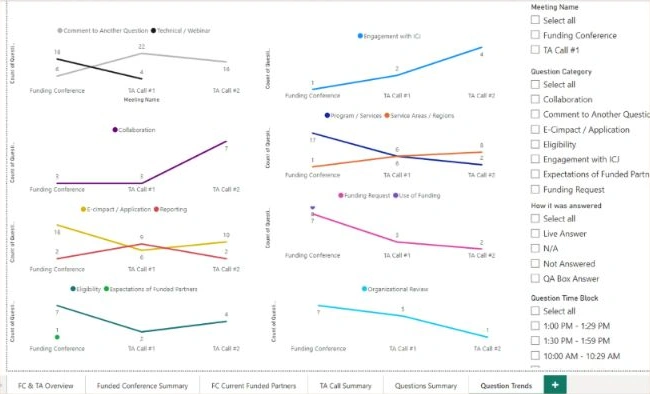
Screenshots from Gerry Taylor II’s professional Power BI presentation. The original slides contain dashboard titles and screenshots without explanatory paragraphs.
Get in touch ↗