Turning Rogue Company game footage into structured match records and an Excel dashboard to help a friend’s Twitch gaming group explore its performance.
ExcelManual data collectionETLDashboard designPerformance analysis
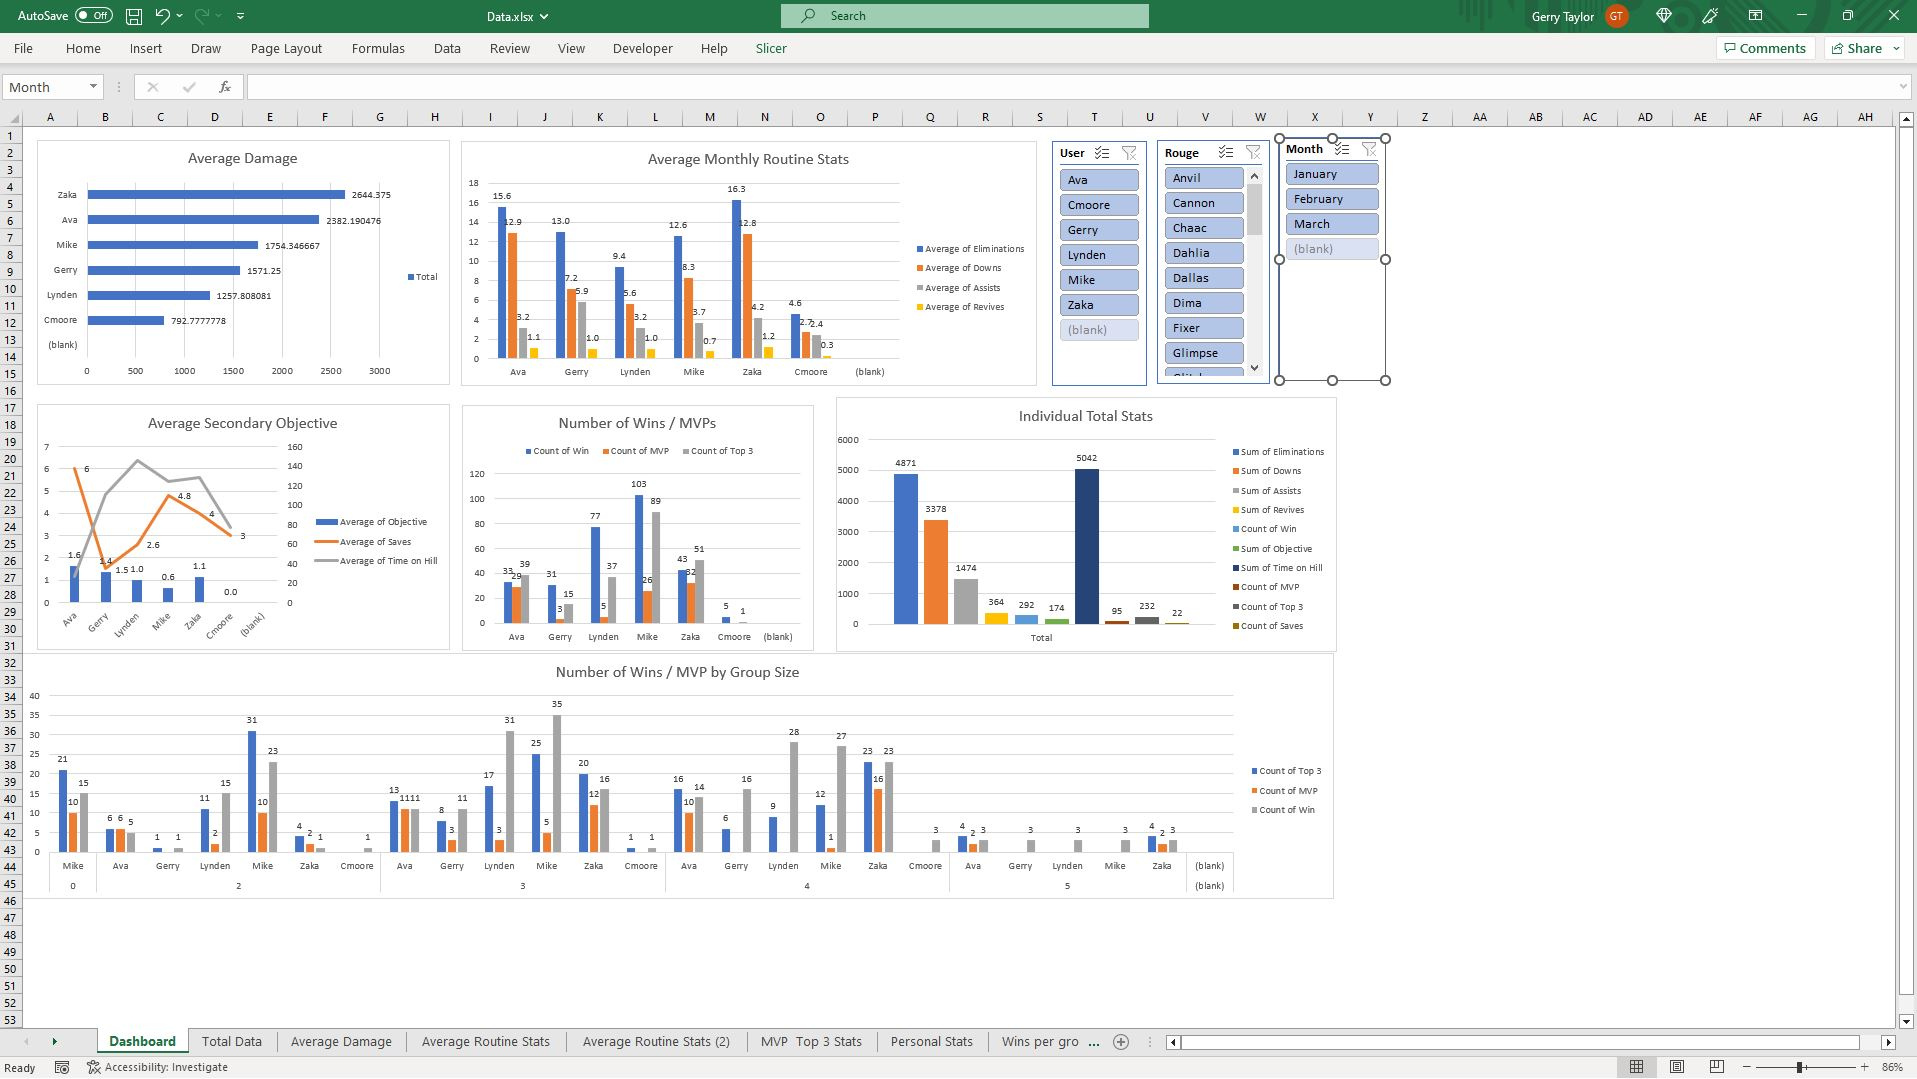
Original Excel dashboard built from manually collected Rogue Company match statistics.
01 / THE QUESTION
The question
How could we use recorded gameplay to understand which players performed better in specific match types and with particular characters?
02 / THE APPROACH
The approach
Reviewed Rogue Company game footage and manually collected player-level match statistics.
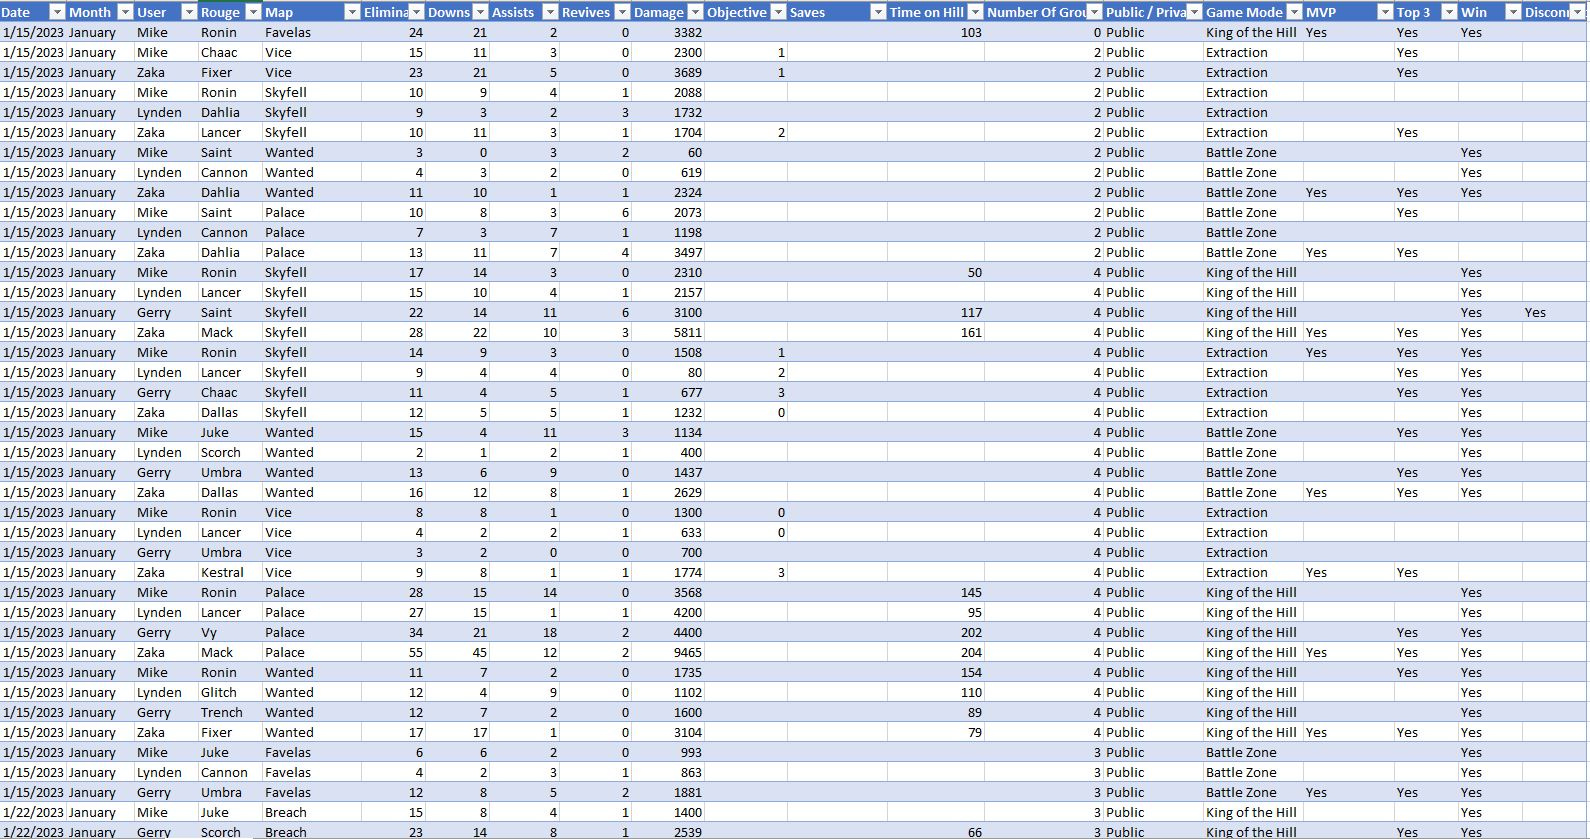
Organized observations into structured Excel records with player, character, map, game mode, group size, performance measures, and outcomes.
Used a manual ETL workflow to turn unstructured footage into data that could be summarized and compared.
Built Excel dashboard views for combat performance, objectives, wins, MVPs, and group-size comparisons.
Added filters for player, character, month, and game mode so the group could explore performance in context.
03 / KEY INSIGHTS
Key insights
Match context matters: combat statistics, objective contributions, character choice, game mode, and group size provide different views of performance. The dashboard supports those comparisons, while totals alone can reflect differences in the number of recorded matches rather than player ability.
04 / OUTCOME & IMPACT
Outcome & impact
Created a structured match dataset and an Excel dashboard from manually reviewed footage. The work gave the friend group a way to explore player performance by match type and character, while demonstrating my ability to turn unstructured information into usable data. No measured increase in Twitch viewers or subscribers is claimed.
THE PROJECT IN DETAIL
Project walkthrough
SLIDE 01
Starting with a friend’s channel
I wanted to help my friend understand our group’s performance while playing Rogue Company for his Twitch channel. Rather than starting with a ready-made dataset, I reviewed game footage to collect match statistics manually.
The question was practical: which players performed well in particular match types, and with which characters? This channel screenshot provides the project context; it is not a measure of growth caused by the project.
SLIDE 02
Turning footage into structured records
The core of the work was manual data collection and ETL: extracting observations from footage, transforming them into a consistent set of fields, and loading them into an Excel table. I turned an unstructured source into records that could be compared and summarized.
The table captures date, player, character, map, eliminations, downs, assists, revives, damage, objective measures, group size, game mode, and outcomes such as wins and MVPs. Keeping match context alongside the statistics made it possible to ask more specific questions than a single overall ranking.
SLIDE 03
Building the Excel analysis workbook
I built an Excel dashboard around the structured match records. The workbook brings together average damage, routine combat statistics, secondary objectives, wins, MVPs, and individual totals, with controls for player, character, and month.
The supporting worksheets and dashboard views gave the collected data a usable form, allowing the group to explore performance without having to revisit every recording.
SLIDE 04
Comparing performance in context
The dashboard includes a game-mode filter alongside player, character, and month, plus a comparison of wins and MVPs by group size. These views were designed to help us explore where each player performed well and how the match context changed the comparison.
The main result was a structured dataset and a repeatable way to review gameplay. Totals depend on how many matches were recorded, and different modes reward different objectives, so a single total should not be treated as a universal skill ranking. No specific best player-character combination or increase in Twitch viewers is claimed from these screenshots.
Walkthrough reconstructed from Gerry Taylor II’s summary and four original screenshots. The emphasis is manual data collection, ETL, and gameplay analysis; the channel screenshot is historical context, not evidence of audience growth.